

Insightful dashboards
Pipeline, conversion and compliance risk at a glance.
Track enquiries, live applications and completions from a standard dashboard, then build the bespoke views your business reports on. The numbers come from the live pipeline, not a spreadsheet updated on Fridays.
- 30 minutes
- No slide deck
- No obligation
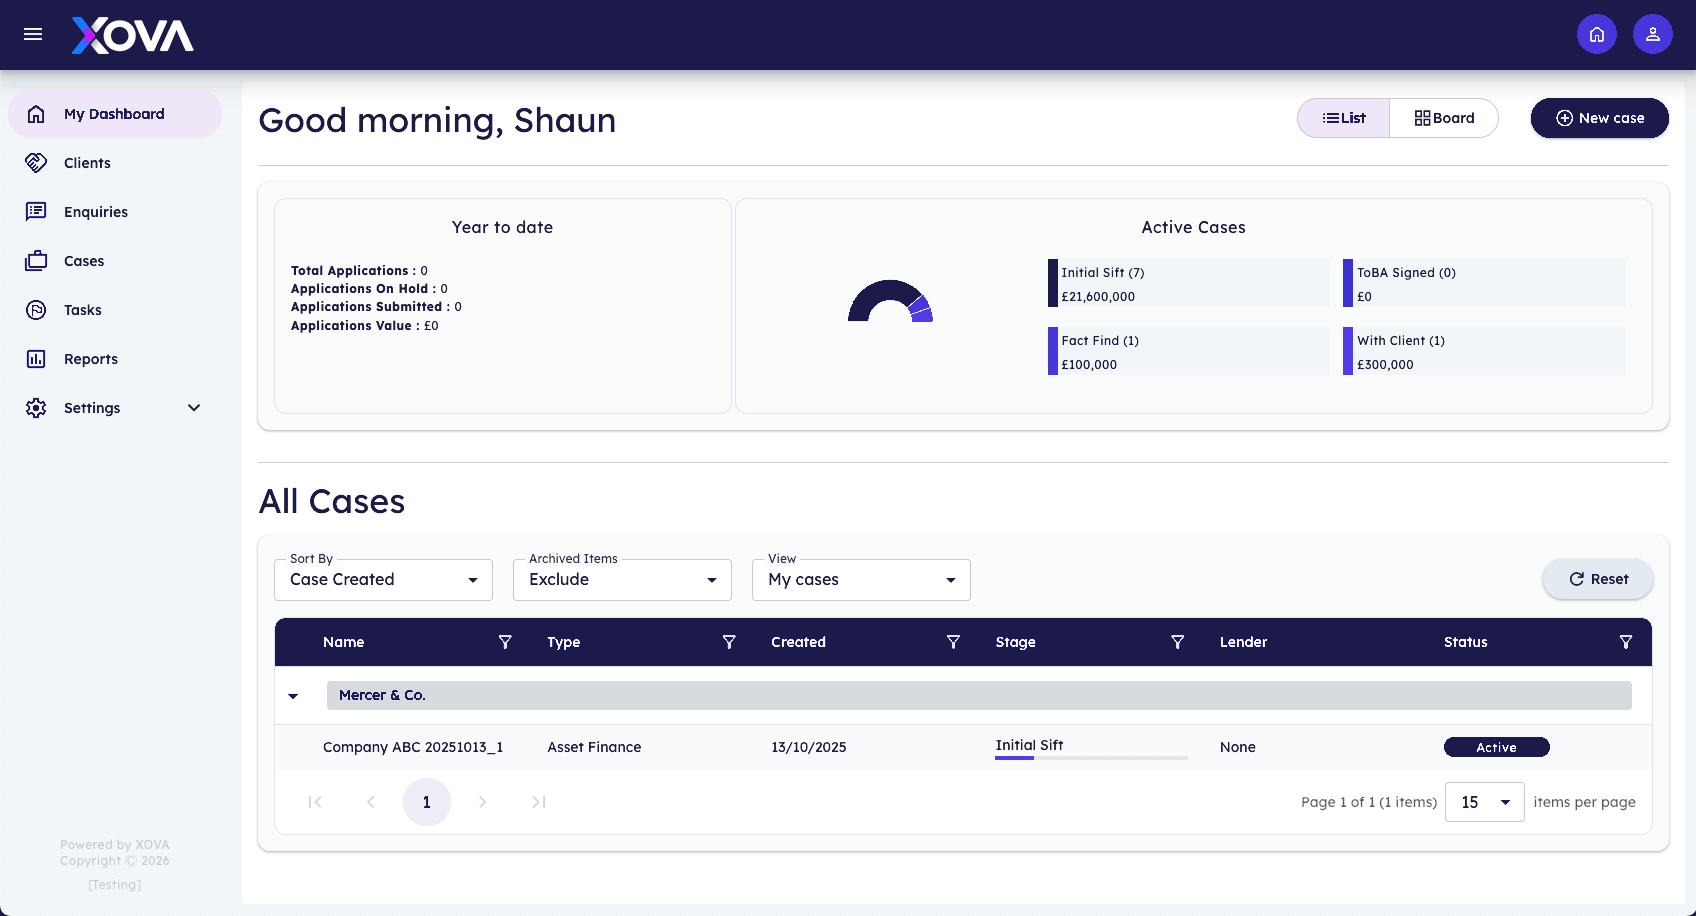
Actual Xova platform view showing insightful dashboards.
Numbers from the work itself
Every figure traces back to a live record. There is no reconciliation step, no weekly export, and no argument about whose version of the pipeline is correct before a management meeting can start.
- Live figures, no manual updates
- Drill from any number to the files behind it
- One shared definition of each metric
Views for each audience
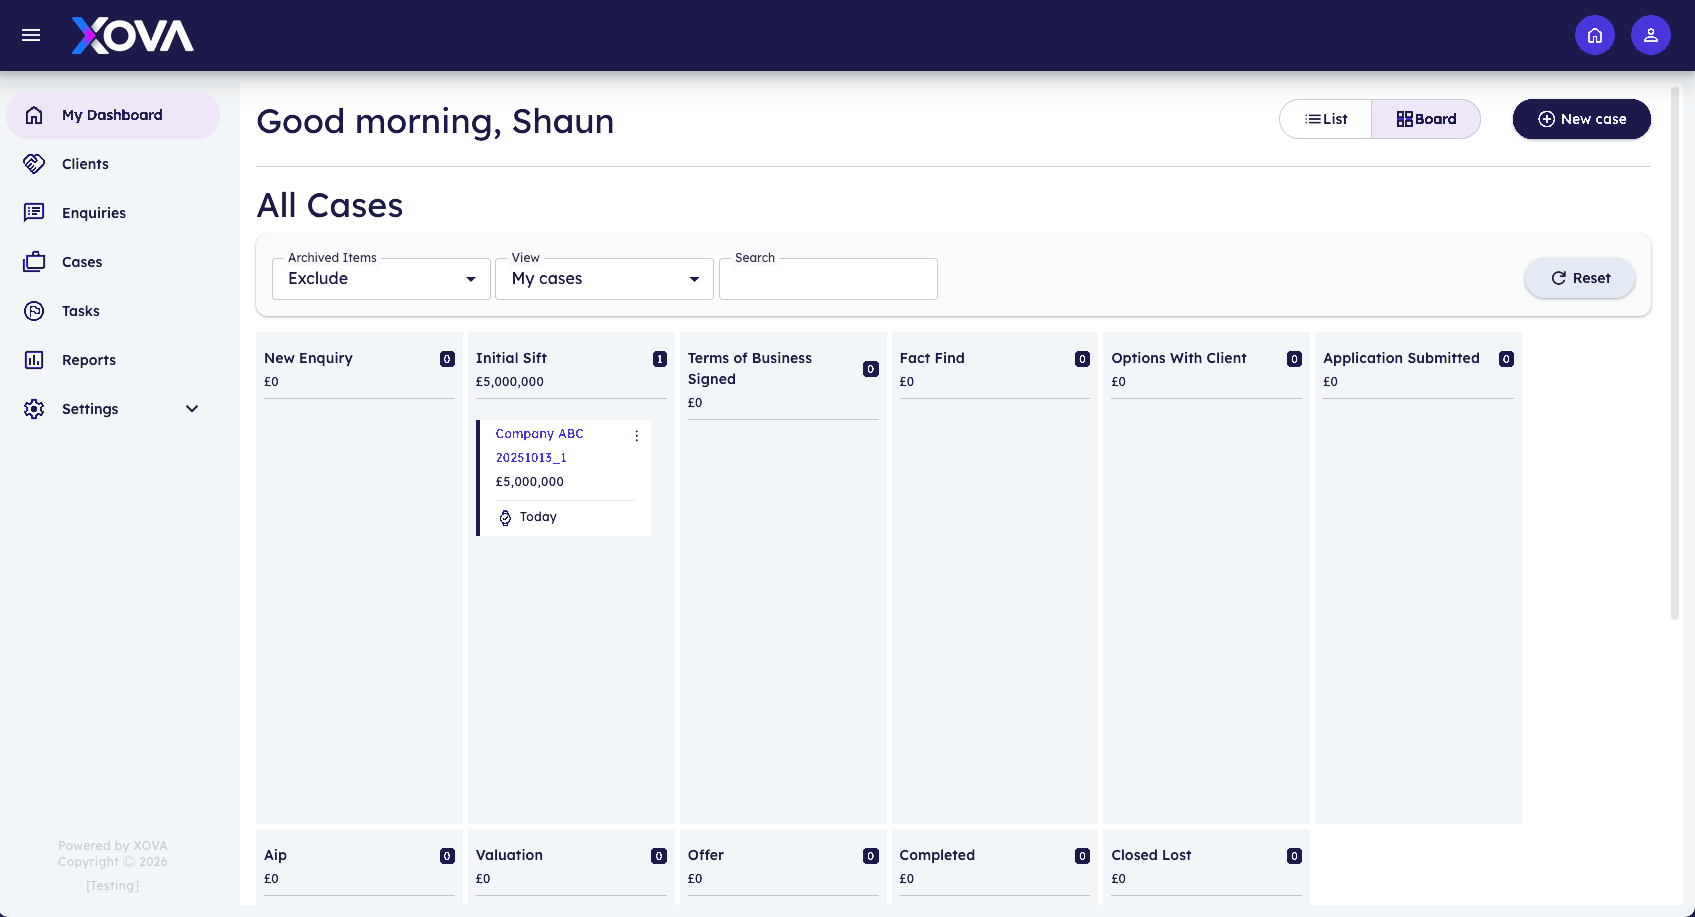
A broker wants their own week. A team lead wants workload and stalled files. The board wants conversion, value and trend. Build each view once and let each audience open the one that answers their question.
- Personal, team and board views
- Filter by product, source and owner
- Scheduled email summaries
Dashboard views

Live cases
46
At risk
4
Capacity
78%
Filtered by team · All products
Risk as well as revenue
Alongside pipeline value, surface the operational and compliance signals: files past service level, outstanding checks, documents awaiting signature. Problems show up as numbers before they show up as complaints.
- Service-level and stalled-file tracking
- Outstanding compliance checks by team
- Trend view across periods
Performance and risk
Pipeline value
£8.4m
Files at risk
4
See insightful dashboards on one of your own cases.
A 30-minute walkthrough configured around the products you broker.
- 30 minutes
- No slide deck
- No obligation
UK hosted
Client data stays in the United Kingdom.
Full audit trail
Every check, document and decision is time stamped.
Built for UK GDPR
Retention, access and consent handled inside the client record.
API first
Connects to the tools your desk already runs on.
How it works
Insightful dashboards in four steps
Start standard
Open the built-in enquiry, live and completed views on day one.
Add your metrics
Build the measures your business actually manages by.
Share
Publish views to teams and schedule summaries by email.
Act
Drill from a number straight into the files that produced it.
“Reporting should tell you what to do on Monday, not what happened three Fridays ago.”
Questions
Frequently asked
Can we export the data?
Yes. Views export to spreadsheet, and the API exposes the same data for your own reporting stack.
Can brokers see each other's numbers?
Visibility follows your permissions, so you decide what is personal, what is team-level and what is open.
How current are the figures?
They read from the live pipeline, so a stage change is reflected as soon as it happens.
Further reading
From the Insights desk
Lending
Proving a credible exit strategy on bridging and development deals
Short-term lenders underwrite the exit as closely as the asset. A vague sale-or-refinance line is where too many strong deals stall in credit.
Craig Peterson · 9 September 2026 · 8 min read
Read articleOperations
Broker pipeline management: knowing which deals are actually real
Most broker pipelines are optimistic rather than accurate. Here's how to define stages properly, track conversion honestly, and stop stale deals inflating the forecast.
Craig Peterson · 9 September 2026 · 8 min read
Read articleGrowth
Scaling a broker firm past the founder
Most commercial finance brokerages stall at the point where the founder is the process. Here's how to grow past that without quality falling apart.
Craig Peterson · 9 September 2026 · 8 min read
Read articleSee insightful dashboards against your own process.
We’ll configure a walkthrough around the products you broker.